Power transmission grids modeling
Realistic modeling for production and consumption in transmission networks
Real data from transmission grid networks is hard to obtain, for technical and legal reasons. Even when it is publicly available, like on the transparency platform of the European network of transmission grid operators, it is often in limited amount and lacking sufficient granularity for most useful applications.
With my collaborators at the HES-SO, we have created a large dataset of realistic time series for production and consumption in all of continental Europe. It is available as a Zenodo repository, and a data descriptor paper was published in Nature Scientific Data (Gillioz et al., 2025).
The network
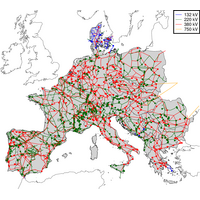
The network is based on PanTaGruEl, a model of the European grid developed by Laurent Pagnier and collaborators. Our version, given in PowerModels format, contains:
- 7822 power lines and 553 transformers,
- 4097 load buses,
- 815 generators of various types.

Synthetic series for variable loads
The first part of our work was to create a statistical model of consumption at every node of the network. The model can generate arbitrarily many synthetic time series that are all different from each other, yet correlated in a realistic manner. These series are then distributed on the nodes based on the population density.

Synthetic series for production
The second part of our work was to design an optimization problem to distribute the production among all the possible power plants in a realistic manner. The resulting time series display all features of a realistic production, including the apparently chaotic on/off behavior of individual hydroelectric power plants, as well as other production modes, while respecting the annual total production of each power plant and reproducing historical aggregated production by type for every country.